
An independent Nookcroft analysis of the latest English Housing Survey data, examining floor space, very small homes, bedrooms, outdoor space and overcrowding across England’s housing tenures.
Space is one of the most important things a home gives us — and one of the hardest things to create when there simply isn’t enough of it.
Much of the conversation around small homes understandably focuses on what people can do with the space they have: better storage, more flexible furniture, smarter layouts and making overlooked areas work harder.
But there is another question worth asking.
How much space do people in England actually have — and how evenly is that space distributed across different types of housing?
To investigate this, Nookcroft analysed the latest published data from the English Housing Survey (EHS), the national survey of housing circumstances and housing conditions in England.
The results reveal substantial differences.
In 2024, just 3% of owner-occupied dwellings had less than 50m² of usable floor area. Among private-rented dwellings, that figure was 17%. In the social-rented sector, it was 26%.
Average floor area tells a similar story. Owner-occupied dwellings averaged 110m², compared with 76m² for private-rented dwellings and 66m² for social-rented dwellings.
Space outside the home also varied sharply. While 92% of owner-occupied dwellings had a private plot, the equivalent figures were 63% in private renting and 61% in social renting.
And when space is considered in relation to the number and composition of people living in a household, another difference emerges: overcrowding remains considerably more prevalent in rented housing than among owner occupiers.
These figures do not mean that renting itself causes a home to be smaller or overcrowded. England’s housing tenures contain different mixes of property types, household types and locations.
But taken together, the data provide a useful picture of how differently residential space is distributed across England’s housing system.
This is The Nookcroft Small Homes Snapshot 2026.
The Snapshot at a Glance
26%
of social-rented dwellings had less than 50m² of usable floor area.
17%
of private-rented dwellings had less than 50m².
3%
of owner-occupied dwellings had less than 50m².
110m² / 76m² / 66m²
was the mean usable floor area of owner-occupied, private-rented and social-rented dwellings respectively.
92% / 63% / 61%
of owner-occupied, private-rented and social-rented dwellings respectively had a private plot.
9% / 6% / 1.1%
were the latest published overcrowding rates for social-rented, private-rented and owner-occupied households respectively.
1. Very Small Homes Are Much More Common in Rented Housing
Perhaps the clearest finding in the data is the difference in the prevalence of very small dwellings across England’s three main housing tenures.
According to the English Housing Survey, 3% of owner-occupied dwellings had less than 50m² of usable floor area in 2024.
That compares with 17% of private-rented dwellings and 26% of social-rented dwellings.
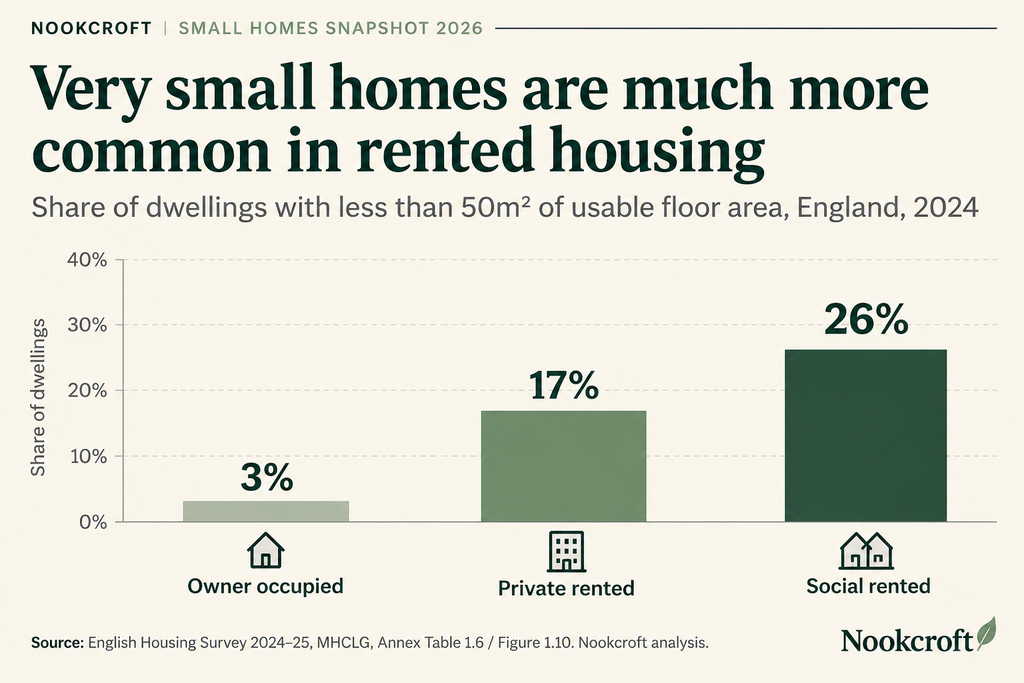
Owner occupied — 3%
Private rented — 17%
Social rented — 26%
Source: English Housing Survey 2024–25, MHCLG, Annex Table 1.6 / Figure 1.10. Nookcroft analysis.
The difference is substantial.
Using the published percentages, the share of private-rented dwellings below 50m² is approximately 5.7 times the owner-occupied rate.
For social-rented dwellings, it is approximately 8.7 times the owner-occupied rate.
These are Nookcroft calculations based on percentages published to the nearest whole percentage point, so the ratios should be treated as approximate comparisons.
The underlying finding is nevertheless clear: very small dwellings form a much larger part of England’s rented housing stock than its owner-occupied stock.
That distinction matters when we talk about making small homes work.
Storage furniture, better organisation and more efficient layouts can improve how a compact home functions, but they cannot create additional floor area. For households living in genuinely small dwellings, every part of the home has to work harder.
The EHS itself provides important context for these figures. The mix of dwelling types varies considerably between tenures, with flats accounting for a much larger proportion of rented housing than owner-occupied housing.
We return to that later in this Snapshot because it is important not to mistake an association between tenure and dwelling size for evidence that tenure itself causes smaller homes.
Source: English Housing Survey 2024–25, Profile of households and dwellings, Annex Table 1.6 / Figure 1.10.
2. Average Floor Area Also Differs Substantially by Tenure
The under-50m² figures show how common very small dwellings are.
Average usable floor area gives us another way of looking at the same housing landscape.
Across all English dwellings, mean usable floor area was 96m² in 2024.
But that average masks large differences between tenures.
Owner-occupied dwellings had a mean usable floor area of 110m².
Private-rented dwellings averaged 76m².
Social-rented dwellings averaged 66m².
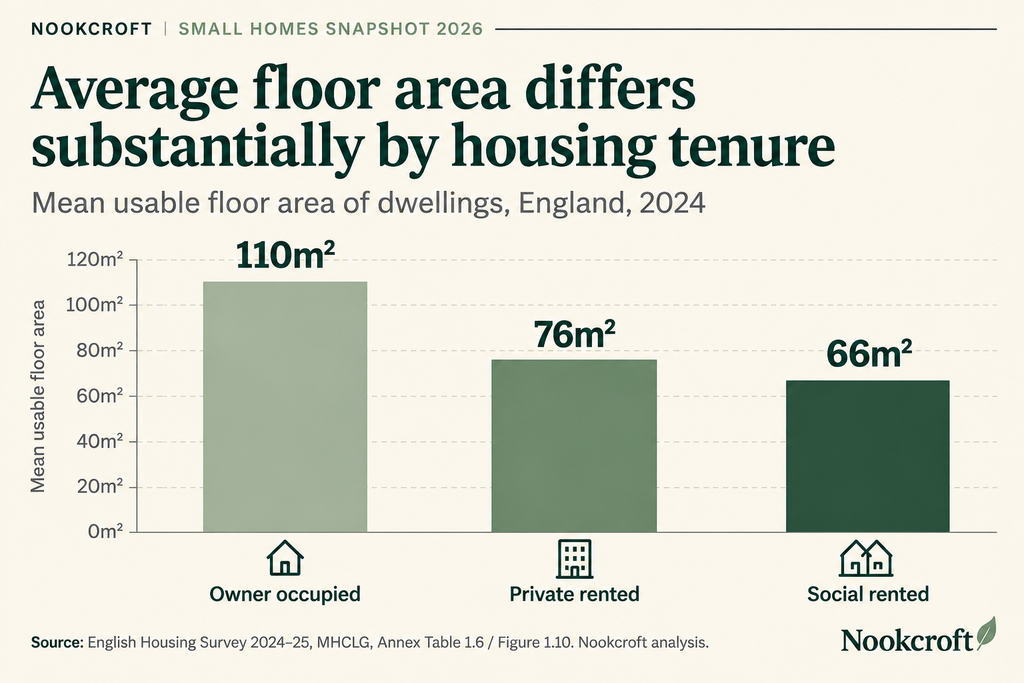
Owner occupied — 110m²
Private rented — 76m²
Social rented — 66m²
Source: English Housing Survey 2024–25, MHCLG, Annex Table 1.6 / Figure 1.10. Nookcroft analysis.
Measured against the owner-occupied average, private-rented dwellings had approximately 30.9% less mean usable floor area.
Social-rented dwellings had 40.0% less.
These are Nookcroft calculations based on the published mean floor-area figures.
They should not be interpreted as saying that every rented home is smaller than every owner-occupied home. There is substantial variation within every tenure.
The averages instead tell us something about the housing stock as a whole.
The difference between the published averages is 34m² between owner occupation and private renting, and 44m² between owner occupation and social renting.
For a small-home website such as Nookcroft, this is an important distinction.
A lack of storage is not always primarily a storage problem.
Sometimes it is a space problem.
When bedrooms, kitchens, hallways and living areas are compact, ordinary possessions compete for a smaller amount of usable space. Furniture choices matter more. Vertical storage can become more valuable. Rooms may need to perform multiple functions.
That does not mean every small home should be filled with storage solutions. Overfilling a compact room can make it considerably harder to use.
It does mean that practical small-space advice needs to recognise that households across England are working with materially different amounts of residential space.
Source: English Housing Survey 2024–25, Profile of households and dwellings, Annex Table 1.6 / Figure 1.10.
3. The Bedroom Mix Has Shifted Towards One-Bedroom Households
Floor area gives us one measure of space.
Bedrooms give us another.
The latest English Housing Survey identifies changes in the number of bedrooms available to households when compared with the pre-pandemic period.
In the private-rented sector, 18% of households had one bedroom in 2019–20.
By 2024–25, that had increased to 21%.
In the social-rented sector, the share increased from 28% to 32%.
Owner occupation also recorded an increase, although from a much smaller base: from 3% to 4%.
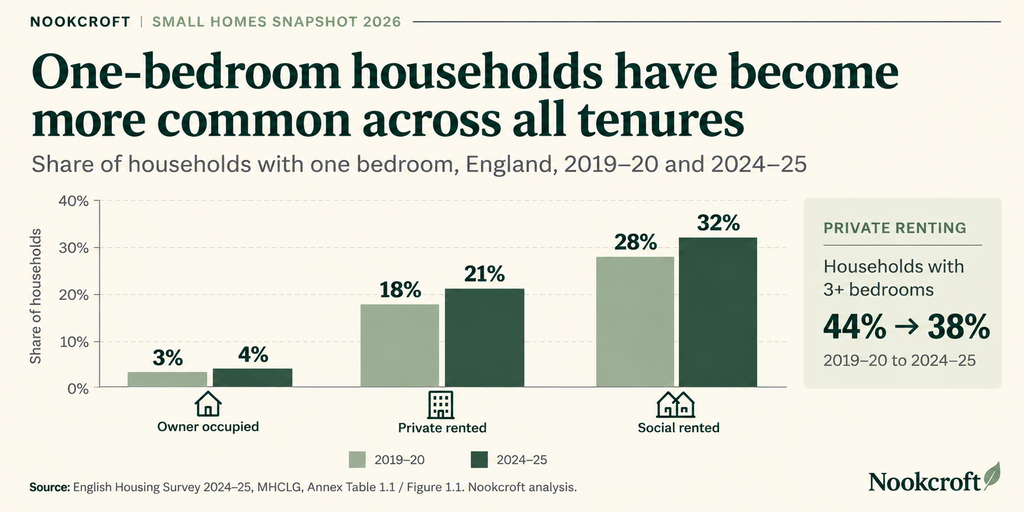
Owner occupied — 3% → 4%
Private rented — 18% → 21%
Social rented — 28% → 32%
Source: English Housing Survey 2024–25, MHCLG, Annex Table 1.1 / Figure 1.1.
There was another notable change within private renting.
The proportion of private-rented households with three or more bedrooms fell from 44% in 2019–20 to 38% in 2024–25.
That gives us a more complete picture than the one-bedroom statistic alone.
Within the private-rented sector, the distribution has shifted towards a greater share of households with one bedroom and a smaller share with three or more.
There is an important limitation here.
These figures describe the number of bedrooms available to households. They do not demonstrate that individual properties have physically become smaller over the period.
We therefore should not conclude from these statistics that rented homes themselves are shrinking.
There has also been a wider change in household composition. Across all tenures, mean household size fell from 2.4 people in 2019–20 to 2.2 in 2024–25.
That is another reason not to interpret bedroom counts as a simple measure of declining housing space.
What the data do establish is that the bedroom distribution experienced by rented-sector households has changed since the pre-pandemic period.
For households living in one-bedroom homes, flexibility can become particularly important. A living room may also need to provide workspace. A dining area may occupy part of a kitchen or lounge. Storage needs to be incorporated without making the remaining living space difficult to use.
Those are exactly the kinds of compromises that practical small-home design needs to address.
Source: English Housing Survey 2024–25, Housing quality, Annex Table 1.1 / Figure 1.1.
4. The Space Divide Continues Outside the Home
Living space is not limited to what sits inside the front door.
For many households, access to a garden, yard, patio or other private outdoor area can provide valuable additional space.
The English Housing Survey records the land immediately surrounding a dwelling as its plot. A plot can be private — for the sole use of the dwelling — or shared with other households, and can contain hard or soft landscaping.
Across England, 82% of dwellings had a private plot in 2024.
Again, however, the overall figure hides considerable differences between tenures.
Among owner-occupied dwellings, 92% had a private plot.
For private-rented dwellings, the figure was 63%.
For social-rented dwellings, it was 61%.
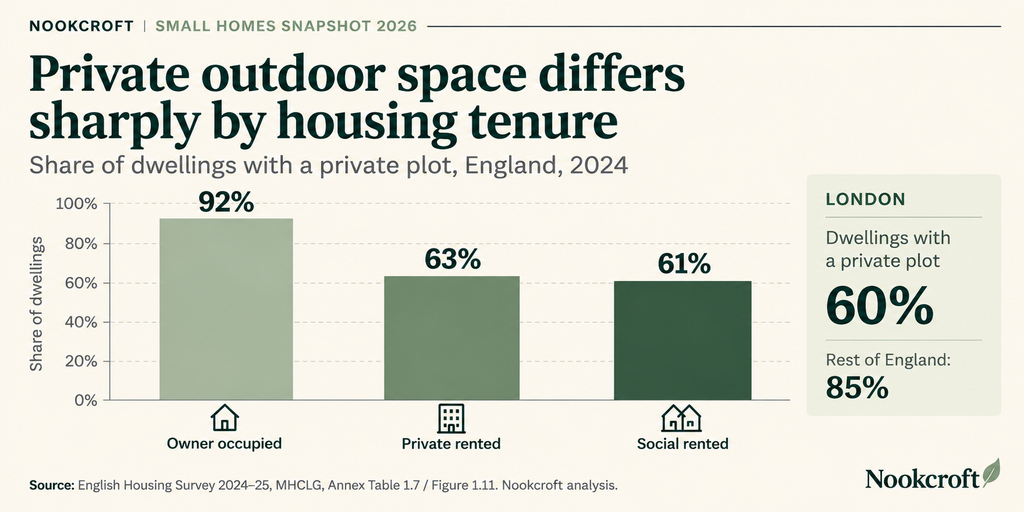
Owner occupied — 92%
Private rented — 63%
Social rented — 61%
Source: English Housing Survey 2024–25, MHCLG, Annex Table 1.7 / Figure 1.11.
That creates a 29 percentage-point gap between owner occupation and private renting, and a 31 percentage-point gap between owner occupation and social renting.
Outdoor space can perform functions that become harder inside a compact home: somewhere to sit, grow plants, dry washing or store suitable outdoor items, as well as simply providing separation from the indoor living environment.
But the terminology matters.
The EHS definition of a private plot is broader than a conventional garden. It can include hard landscaping such as paving, concrete, tarmac or gravel as well as lawns and flowerbeds.
For that reason, throughout this Snapshot we use the EHS term rather than describing every private plot as a garden.
There has also been some movement within private renting.
The proportion of private-rented dwellings with a private plot decreased from 67% in 2019 to 63% in 2024. The EHS reports no significant equivalent change in the owner-occupied or social-rented sectors over that period.
London Stands Apart
Geography adds another dimension.
In London, 60% of dwellings had a private plot, compared with 85% across the rest of England.
London — 60%
Rest of England — 85%
That is a 25 percentage-point difference.
London dwellings were also considerably more likely to have access to a shared plot: 35% compared with 14% across the rest of England.
These figures should not be extended beyond what they tell us. They do not establish that the same London-versus-rest-of-England difference exists in usable internal floor area.
They do illustrate how geography can substantially affect the amount and type of space immediately surrounding a home.
Source: English Housing Survey 2024–25, Profile of households and dwellings, Annex Table 1.7 / Figure 1.11.
5. Overcrowding Reveals a Different Side of the Space Problem
A small dwelling is not necessarily overcrowded.
A household can live in a compact home while still having sufficient bedrooms under the official measure. Likewise, floor area alone does not determine whether a household is overcrowded.
The English Housing Survey measures overcrowding using the bedroom standard.
This compares the number of bedrooms available with the number considered necessary to avoid undesirable sharing, taking into account the number, ages and relationships of household members.
The latest published EHS estimate puts the overall overcrowding rate in England at 3%, representing approximately 824,000 households.
But prevalence varies substantially by tenure.
The published 2024–25 rates were:
1.1% of owner-occupied households
6% of private-rented households
9% of social-rented households
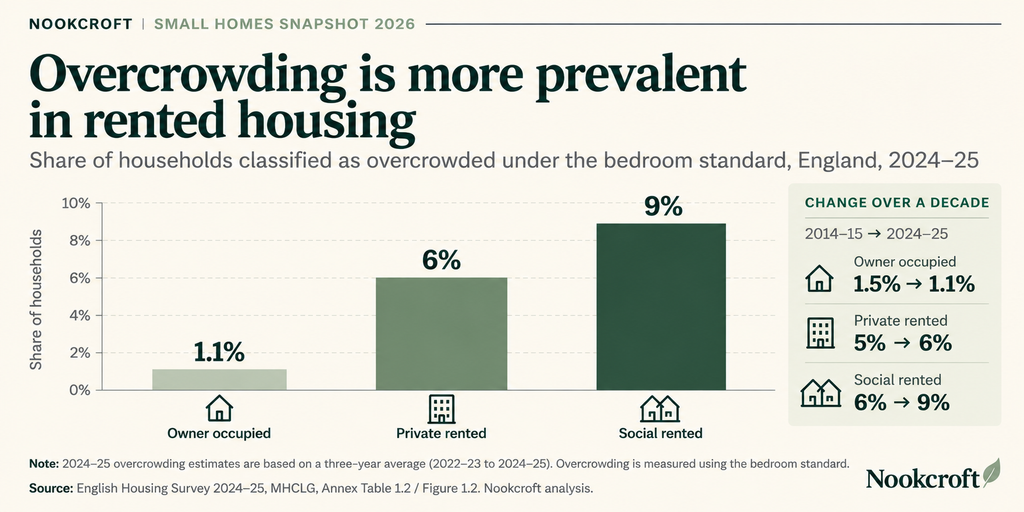
Owner occupied — 1.1%
Private rented — 6%
Social rented — 9%
Source: English Housing Survey 2024–25, MHCLG, Annex Table 1.2 / Figure 1.2.
In estimated household numbers, the EHS reports approximately 173,000 overcrowded owner-occupied households, 286,000 private-rented households and 365,000 social-rented households.
The longer-term trend is also notable.
In the social-rented sector, the overcrowding rate increased from 6% in 2014–15 to 9% in 2024–25.
In private renting, it increased from 5% to 6%.
Among owner occupiers, it decreased from 1.5% to 1.1%.
These statistics require an important methodological qualification.
There are too few overcrowded households in an individual EHS survey year to produce sufficiently reliable single-year estimates. The EHS therefore combines data from the three most recent survey years.
The estimate labelled 2024–25 consequently combines 2022–23, 2023–24 and 2024–25.
The EHS itself advises care when interpreting individual year-on-year changes.
This is also where the distinction between small and overcrowded becomes particularly important.
A one-person household living in a compact flat may have relatively little floor area while still having sufficient bedroom space under the bedroom standard.
A larger household living in a property with too few bedrooms faces a different problem.
Good small-home design can make limited space function better.
It cannot resolve genuine overcrowding.
Source: English Housing Survey 2024–25, Housing quality, Annex Table 1.2 / Figure 1.2.
6. Why Tenure Alone Does Not Explain the Differences
Taken without context, the figures in this Snapshot could produce an overly simple conclusion:
Owner-occupied homes are larger; rented homes are smaller; therefore renting causes people to have less space.
The English Housing Survey does not establish that.
One of the clearest reasons for caution is the very different mix of dwelling types found within each tenure.
In 2024, 7% of owner-occupied dwellings were low-rise purpose-built flats.
The equivalent proportion was 25% among private-rented dwellings.
Among social-rented dwellings, it was 39%.
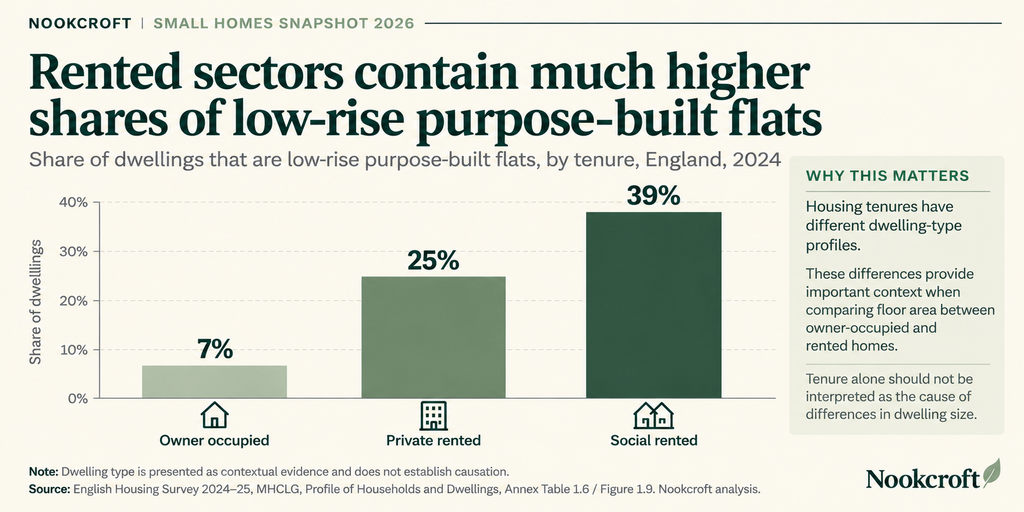
Owner occupied — 7%
Private rented — 25%
Social rented — 39%
Source: English Housing Survey 2024–25, MHCLG, Annex Table 1.6 / Figure 1.9.
Owner-occupied dwellings, by contrast, were much more likely to be houses.
Thirty per cent were semi-detached and 26% detached. In private renting, the equivalent figures were 15% and 6%, while in social renting they were 15% and less than 1% respectively.
The EHS itself points to the predominance of flats in the social sector when discussing its much greater prevalence of sub-50m² dwellings.
In other words, the housing occupied across different tenures has a different structural mix.
There are other differences too.
Tenures vary by geography, age profile, household composition and income. London, for example, has a substantially larger rented sector than the rest of England.
These factors can interact with the type and amount of housing space available.
This Snapshot therefore describes differences associated with tenure.
It does not claim that tenure alone causes those differences.
That distinction is central to Nookcroft’s interpretation of the data.
Source: English Housing Survey 2024–25, Profile of households and dwellings, Annex Table 1.6 / Figure 1.9.
What Does the Data Tell Us About Small Homes in England?
Taken together, these findings paint a more complicated picture than a simple debate about whether homes are “too small”.
Small-home living is not distributed evenly across England’s housing system.
Very small dwellings are substantially more common within rented housing.
Average usable floor area is lower in both rented sectors than in owner occupation.
The bedroom distribution within rented households has shifted towards a greater proportion of one-bedroom households compared with 2019–20.
Private outdoor space is also less common among rented dwellings.
And when household requirements are considered through the bedroom standard, overcrowding is substantially more prevalent in rented housing.
At the same time, these findings need context.
The housing stock occupied by owners, private renters and social renters is not the same.
Rented sectors contain much larger proportions of purpose-built flats, while owner occupation contains considerably more detached and semi-detached housing.
Household characteristics and geography also differ between tenures.
The evidence therefore supports a careful conclusion:
Access to residential space differs substantially across England’s housing tenures, and rented sectors contain higher proportions of several indicators associated with limited space.
That is not the same as saying every rented home is small, every owner-occupied home is spacious, or tenure itself causes these outcomes.
Housing rarely lends itself to explanations that simple.
What This Means for Nookcroft
Nookcroft was created around a simple idea: helping people make more of the homes they actually live in.
That means ordinary UK homes rather than perfect show homes.
Small bedrooms. Narrow hallways. Compact kitchens. Rented properties where permanent changes may not be possible. Small gardens and balconies. Living rooms that also need to work as dining areas or home offices.
The findings in this Snapshot provide context for why those challenges matter.
When a substantial share of rented housing sits at the smaller end of England’s housing stock, making limited space work well is more than an interior-design trend.
For many households, it is simply part of everyday life.
That is why our approach to small homes is not about squeezing as much furniture and storage into a room as possible.
A successful small space needs to remain usable.
Sometimes that means adding storage. Sometimes it means choosing furniture that performs more than one job. Sometimes it means using an overlooked wall, corner or area beneath the stairs.
And sometimes the best improvement is removing something the room does not need.
The aim is not to pretend clever organisation can solve every housing problem.
As the overcrowding figures demonstrate, there are limits to what design and organisation can achieve.
Instead, Nookcroft focuses on the part residents can realistically influence: making the space available to them function as well as possible.
Sources and Methodology
About the English Housing Survey
The Nookcroft Small Homes Snapshot 2026 is an independent analysis of published data from the English Housing Survey, produced by the Ministry of Housing, Communities and Local Government.
The English Housing Survey publications used for this analysis are designated Accredited Official Statistics.
The EHS combines information collected from households with physical surveys of dwellings, but the two types of results use different samples and reporting periods.
That distinction is important.
Household statistics
Results concerning households are reported as 2024–25.
They are based on fieldwork conducted between March 2024 and March 2025 using the EHS full household sample of 16,438 households.
In this Snapshot, the bedroom-distribution and overcrowding findings are household statistics.
Physical-dwelling statistics
Results concerning the physical dwelling are reported as 2024.
They are based on physical-survey fieldwork conducted between March 2023 and March 2025, weighted to a midpoint of April 2024, using a sample of 14,919 occupied and vacant dwellings.
In this Snapshot, usable floor area, dwelling type and private-plot findings are physical-dwelling statistics.
We preserve that distinction throughout the analysis.
How Nookcroft Analysed the Data
For transparency, the information in this Snapshot falls into three categories.
Official figure
A statistic directly published by the English Housing Survey or the Ministry of Housing, Communities and Local Government.
Examples include:
- 17% of private-rented dwellings having less than 50m² usable floor area.
- Mean usable floor area of 110m² for owner-occupied dwellings.
- 63% of private-rented dwellings having a private plot.
- 6% of private-rented households being overcrowded.
Nookcroft calculation
A calculation made by Nookcroft using published official figures.
For example, comparing the published 17% private-rented sub-50m² figure with the 3% owner-occupied figure gives an approximate ratio of 5.7 to 1.
Where calculations rely on rounded published percentages, we describe the result as approximate.
Nookcroft interpretation
Our explanation of what a statistic or combination of statistics may tell us.
Interpretation is deliberately kept separate from the underlying official figure.
Where the evidence does not establish causation, we do not claim causation.
Definitions
Usable floor area
This Snapshot uses the usable-floor-area figures published by the English Housing Survey.
Private plot
The EHS uses plot to describe the land immediately surrounding a dwelling.
A private plot is for the sole use of that dwelling. It may contain hard landscaping, such as paving, gravel or concrete, soft landscaping such as lawns or flowerbeds, or a combination.
For that reason, private plot should not automatically be interpreted as private garden.
Overcrowding
Overcrowding is measured using the bedroom standard.
This compares the number of bedrooms available with the number required to avoid undesirable sharing, taking into account the number, ages and relationships of household members.
Because the number of overcrowded households sampled in any individual EHS year is relatively small, the published overcrowding estimates combine three survey years.
Limitations
This Snapshot is an independent Nookcroft analysis of existing official statistics. Nookcroft did not conduct the underlying household interviews or physical dwelling inspections.
The analysis describes patterns in the published data rather than establishing why those patterns exist.
Differences between housing tenures should be interpreted carefully because owner-occupied, private-rented and social-rented housing differ in dwelling type, geography and household characteristics.
Mean floor area is an average and does not represent every dwelling within a tenure.
Bedroom-distribution figures describe bedrooms available to households and should not be interpreted as evidence that individual dwellings have physically become smaller.
Private-plot figures should not automatically be interpreted as garden ownership.
Overcrowding statistics are based on three-year averages and should not be treated as precise single-year measurements.
Figures published by the EHS are sometimes rounded. Nookcroft calculations derived from those figures may therefore also reflect rounding.
Finally, this report concerns England.
Its findings should not be described as representative of the entire United Kingdom.
Original Data Sources
The principal sources used for this Snapshot are published by the Ministry of Housing, Communities and Local Government.
English Housing Survey 2024–25: Profile of households and dwellings
Used for dwelling type, usable floor area, tenure and private-plot statistics.
English Housing Survey 2024–25: Housing quality
Used for bedroom availability, overcrowding and longer-term overcrowding comparisons.
English Housing Survey 2024–25: Annex tables — Demographics and household resilience
Used to verify the underlying dwelling and household statistics used in the analysis.
English Housing Survey 2024–25: Annex tables — Housing quality and energy efficiency
Used to verify bedroom and overcrowding statistics.
English Housing Survey 2024–25: Technical report and technical notes
Used to understand survey design, samples, data collection, weighting, definitions and reliability.
Readers can consult the original government publications and underlying annex tables to verify the statistics used in this report.
About Nookcroft
Nookcroft is an independent UK home website focused on practical ideas for real homes.
We publish useful guidance on small-space living, storage, renting, simple DIY and small gardens, with an emphasis on realistic improvements that can make everyday homes work better.
The Nookcroft Small Homes Snapshot 2026 forms part of our growing research and feature series exploring the realities behind the homes we live in.
Journalists, publishers and researchers wishing to reference this Snapshot or discuss the findings can contact:
When referencing this research, please attribute analysis and original Nookcroft charts to Nookcroft — The Nookcroft Small Homes Snapshot 2026.
Original Data Sources
The Nookcroft Small Homes Snapshot 2026 is based primarily on data from the English Housing Survey 2024–25, published by the Ministry of Housing, Communities and Local Government (MHCLG). The English Housing Survey is an Accredited Official Statistics source examining housing conditions and households across England.
Usable floor area and very small homes
English Housing Survey 2024–25, Profile of households and dwellings, Annex Table 1.6 and Figure 1.10. This source was used for comparisons of average usable floor area by tenure and the proportion of dwellings with less than 50m² of usable floor area.
Dwelling type by tenure
English Housing Survey 2024–25, Profile of households and dwellings, Annex Table 1.6 and Figure 1.9. This source was used to compare the proportion of low-rise purpose-built flats across owner-occupied, private-rented and social-rented housing.
Private outdoor space
English Housing Survey 2024–25, Profile of households and dwellings, Annex Table 1.7 and Figure 1.11. This source was used for comparisons of dwellings with a private plot by tenure and between London and the rest of England.
Bedrooms by tenure
English Housing Survey 2024–25, Housing quality, Annex Table 1.1 and Figure 1.1. This source was used to examine changes in the proportion of households with one bedroom between 2019–20 and 2024–25, together with changes in the bedroom distribution of private-rented households.
Overcrowding
English Housing Survey 2024–25, Housing quality, Annex Table 1.2 and Figure 1.2. This source was used for overcrowding comparisons between housing tenures and changes over the decade to 2024–25. Overcrowding is measured using the bedroom standard, with the headline 2024–25 estimates based on a three-year average covering 2022–23 to 2024–25.
Nookcroft Analysis
All charts and graphics in this report were created by Nookcroft using data published through the English Housing Survey.
Where figures are reproduced directly from the survey, they are treated as official figures. Where Nookcroft has calculated comparisons, ratios or percentage differences from those figures, these are identified as Nookcroft calculations. Explanations of what the figures may mean in the context of small-home living are presented as Nookcroft interpretation.
The underlying data was collected and published by MHCLG through the English Housing Survey. Nookcroft selected, compared, analysed and visualised the relevant statistics independently for this report.